Historical data visualization · 1858
Florence Nightingale: Diagram of the Causes of Mortality in the Army in the East
Army in the East · April 1854 to March 1856
- Source
- commons.wikimedia.org
- Retrieved
- 27 September 2026
- License
- Public domain (diagram); photograph: CC BY 4.0; notice: MIT
- Rights holder
- Florence Nightingale, 1858; photograph: Wellcome Library, London
- Language
- English

This file is licensed under the Creative Commons Attribution 4.0 International license.
About this edition and its rights
Edition
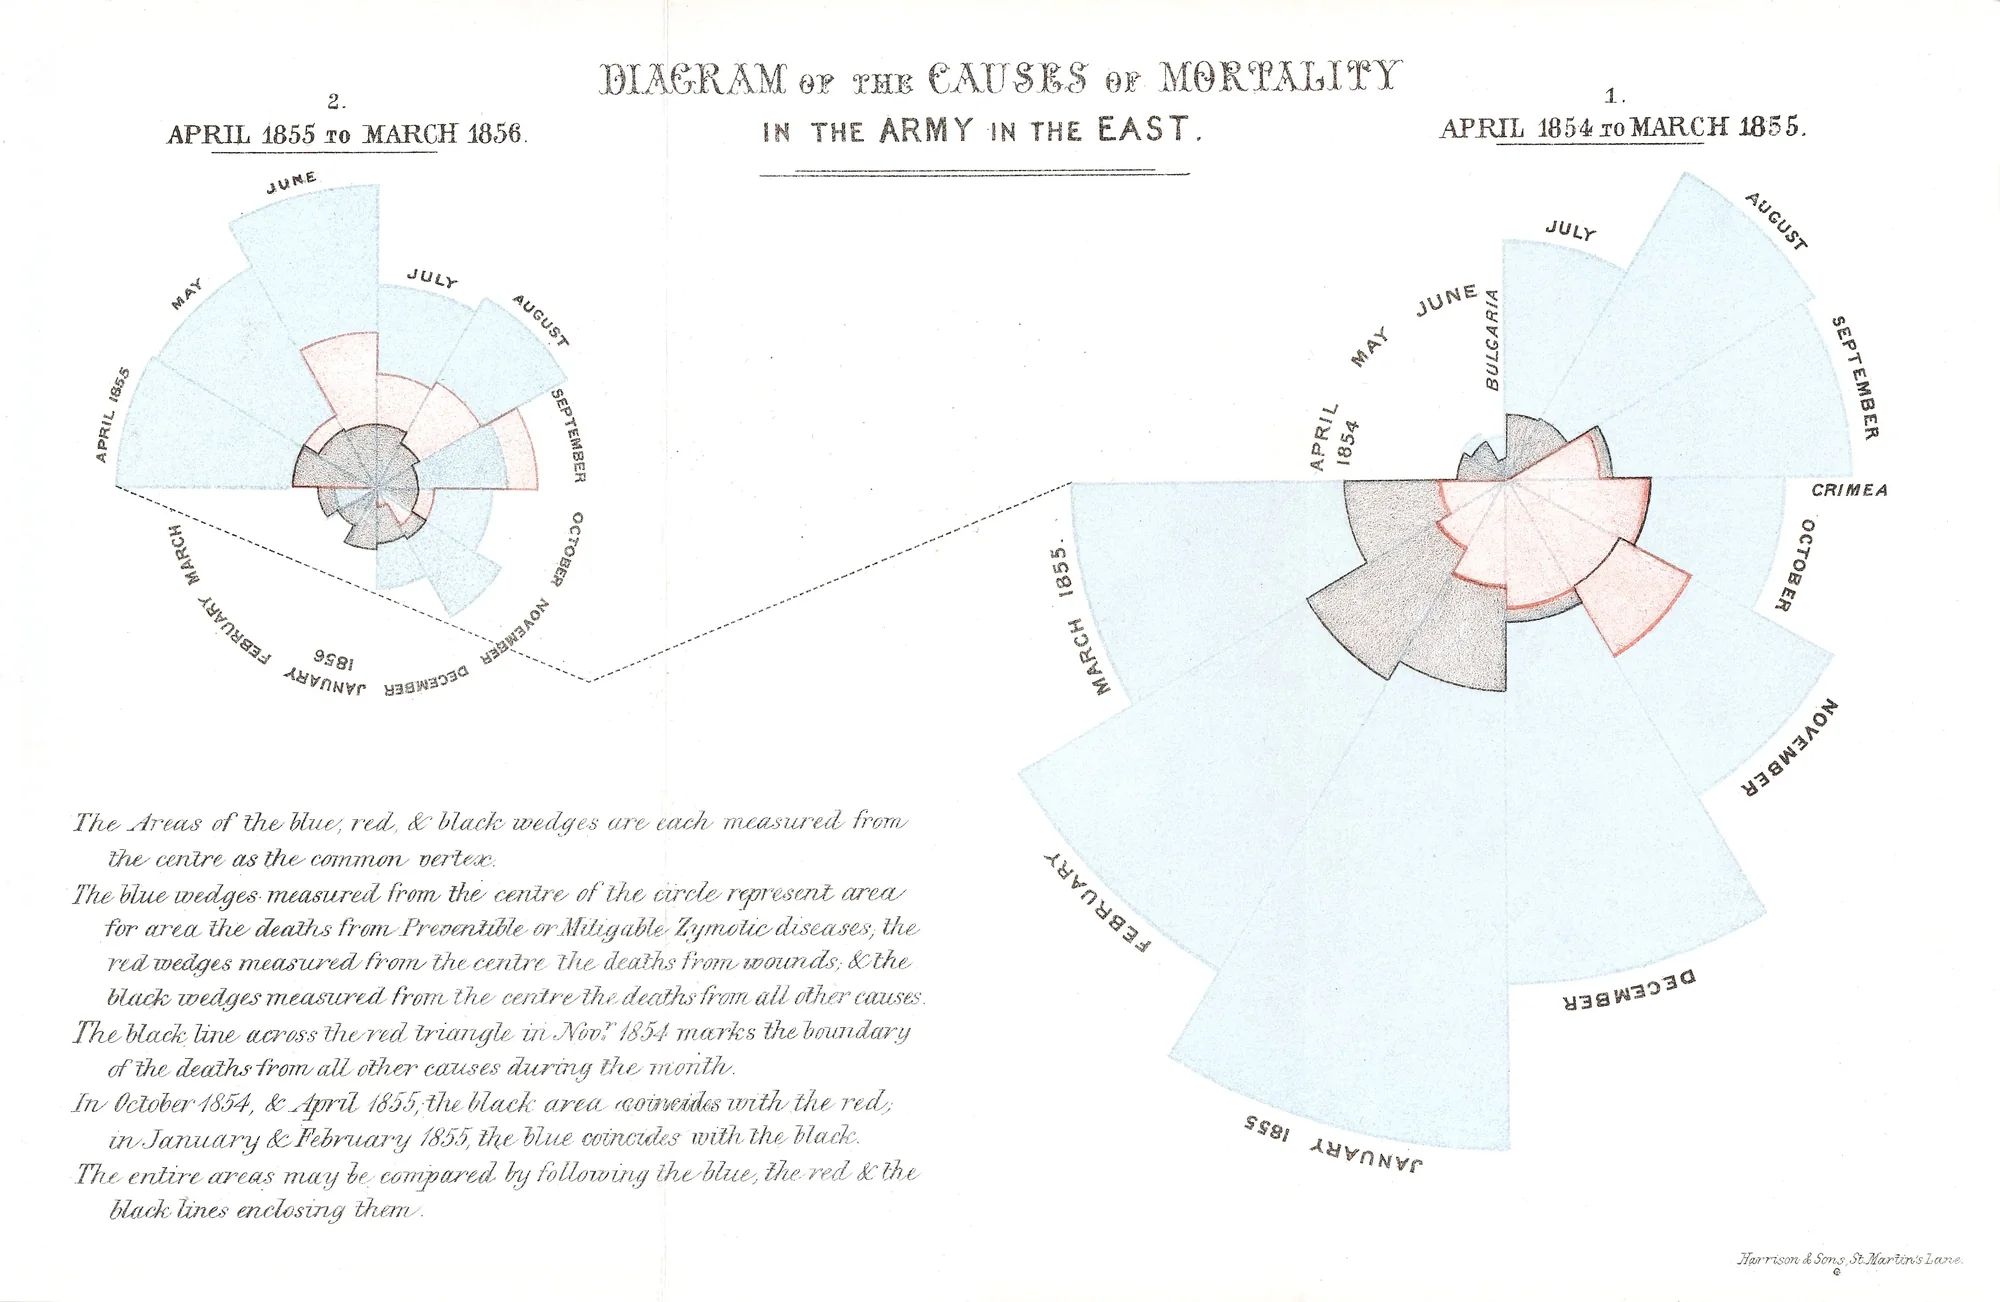
Photograph L0041105 of Wellcome Images (Wellcome Library, London, GC M:WA100 1858N68n) of the plate “Diagram of the Causes of Mortality in the Army in the East” of Florence Nightingale’s Notes on Matters Affecting the Health, Efficiency, and Hospital Administration of the British Army (London, Harrison and Sons, 1858), as uploaded to Wikimedia Commons (3942 x 2566 px), converted from Adobe RGB to sRGB with its embedded profile and its paper tone scaled to white (one gain per channel) for the poster. The legend engraved on the plate is transcribed below the image, one printed item per paragraph, “Novr” with its superscript r (the two strokes under it are not reproduced). The transcription of the legend on the Wikimedia Commons page File:Nightingale-mortality.jpg, made from a later printing, served as a base and was corrected against this plate in eight places. The legend reads “January & February 1855” as engraved on this plate, although in Table No. 2 of the Notes (p. 315) the rates from zymotic diseases and from all other causes are close in January and February 1856, not 1855. The notice below the legend is not a period text: it was written for this poster from the title page, the List of Illustrations and Table No. 2 of the Notes, in the Wellcome Collection scan b20387118.
Rights
Florence Nightingale died in 1910 and the diagram was published in 1858: it is in the public domain in France and in the United States. The Wellcome Collection marks its scan of the Notes (b20387118) with the Public Domain Mark.
License notice: “This file is licensed under the Creative Commons Attribution 4.0 International license.”
Notice of the Wikimedia Commons file page of the photograph, https://commons.wikimedia.org/wiki/File:Diagram_of_the_causes_of_mortality_in_the_army_Wellcome_L0041105.jpg; the file also embeds “Copyrighted work available under Creative Commons Attribution only licence CC BY 4.0 http://creativecommons.org/licenses/by/4.0/” and “Credit: Wellcome Library, London. Wellcome Images”. The footer gives that credit, the license, its URL and the changes made. The notice written for the poster is covered by the MIT license of this repository.
Legend#
As engraved on the plate.
The Areas of the blue, red, & black wedges are each measured from the centre as the common vertex.
The blue wedges measured from the centre of the circle represent area for area the deaths from Preventible or Mitigable Zymotic diseases; the red wedges measured from the centre the deaths from wounds; & the black wedges measured from the centre the deaths from all other causes.
The black line across the red triangle in Novr 1854 marks the boundary of the deaths from all other causes during the month.
In October 1854, & April 1855; the black area coincides with the red; in January & February 1855, the blue coincides with the black.
The entire areas may be compared by following the blue, the red & the black lines enclosing them.
Notice#
A note written for this poster.
The plate bears the imprint of Harrison & Sons, St. Martin’s Lane, who printed Florence Nightingale’s Notes on Matters Affecting the Health, Efficiency, and Hospital Administration of the British Army in London in 1858. She presented the book by request to the Secretary of State for War, and its List of Illustrations places the diagram at page 315.
Each of the two diagrams covers a year, with a wedge for each month: April 1854 to March 1855 on the right, April 1855 to March 1856 on the left. As the legend explains, the deaths of a month are shown by the area of its wedges, measured from the centre.
Table No. 2 of the Notes, on page 315, gives month by month the estimated average strength of the army and the deaths and annual rate of mortality per 1,000 in its hospitals in the East. For January 1855 it records, for an average strength of 32,393 men, 2,761 deaths from zymotic diseases, 83 from wounds and injuries and 324 from all other causes: an annual rate of 1022.8 per 1,000 from zymotic diseases alone. By March 1856 that rate had fallen to 3.9.