Series · 4 posters · 1786 to 1869
The first data visualizations
Four charts and maps drawn between 1786 and 1869: William Playfair’s trade charts, John Snow’s map of the Broad Street cholera deaths (1854), Florence Nightingale’s diagram of the causes of mortality in the army (1858) and Charles Joseph Minard’s map of the French army in Russia in 1812 and 1813.
Plan the wall
The wall planner draws the series to scale in your browser: this needs JavaScript. The posters and their PDFs are listed below.
The previews show each poster as laid out for the A formats, stretched to the chosen format; the PDF of each format is laid out to fill its own page. The figure is 170 cm tall.
The posters
Each poster in its first theme; its page has the others, and a wallpaper.
-
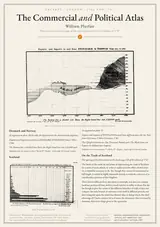
1 · Historical data visualization
William Playfair: The Commercial and Political Atlas
William Playfair, 1786
Print from A3
A series · ivory 7.6 MBA series · white 10.5 MBA series · genesis 7.3 MBA series · blueprint 6.7 MB50 × 70 cm · ivory 7.6 MB50 × 70 cm · white 10.5 MB50 × 70 cm · genesis 7.3 MB50 × 70 cm · blueprint 6.7 MB60 × 80 cm · ivory 7.6 MB60 × 80 cm · white 10.5 MB60 × 80 cm · genesis 7.3 MB60 × 80 cm · blueprint 6.7 MBIn data-viz-us.zip, below
-

2 · Historical data visualization
John Snow: the Broad Street cholera map
John Snow, 1854
Print from A3
A series · ivory 713 KBA series · white 711 KBA series · genesis 713 KBA series · blueprint 713 KB50 × 70 cm · ivory 713 KB50 × 70 cm · white 711 KB50 × 70 cm · genesis 714 KB50 × 70 cm · blueprint 714 KB60 × 80 cm · ivory 713 KB60 × 80 cm · white 711 KB60 × 80 cm · genesis 713 KB60 × 80 cm · blueprint 713 KBIn data-viz-us.zip, below
-
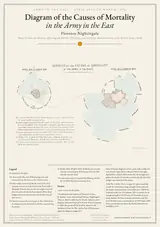
3 · Historical data visualization
Florence Nightingale: Diagram of the Causes of Mortality in the Army in the East
Florence Nightingale, 1858
Print from A3
A series · ivory 1.3 MBA series · white 1.0 MBA series · genesis 1.0 MBA series · blueprint 1.0 MB50 × 70 cm · ivory 1.3 MB50 × 70 cm · white 1.0 MB50 × 70 cm · genesis 1.0 MB50 × 70 cm · blueprint 1.0 MB60 × 80 cm · ivory 1.3 MB60 × 80 cm · white 1.0 MB60 × 80 cm · genesis 1.0 MB60 × 80 cm · blueprint 1.0 MBIn data-viz-us.zip, below
-
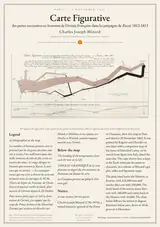
4 · Historical data visualization
Charles Joseph Minard: Carte figurative des pertes successives en hommes de l’Armée Française dans la campagne de Russie 1812-1813
Charles Joseph Minard, 1869
Print from A3
A series · ivory 1.7 MBA series · white 1.6 MBA series · genesis 1.6 MBA series · blueprint 1.6 MB50 × 70 cm · ivory 1.7 MB50 × 70 cm · white 1.6 MB50 × 70 cm · genesis 1.6 MB50 × 70 cm · blueprint 1.6 MB60 × 80 cm · ivory 1.7 MB60 × 80 cm · white 1.6 MB60 × 80 cm · genesis 1.6 MB60 × 80 cm · blueprint 1.6 MBIn data-viz-us.zip, below


US formats
Letter, Tabloid, 18 × 24 and 24 × 36 in are not in the repository but in the latest release, in one zip per category, with every theme:
- Historical data visualization, US formats data-viz-us.zip · William Playfair: The Commercial and Political Atlas, John Snow: the Broad Street cholera map, Florence Nightingale: Diagram of the Causes of Mortality in the Army in the East, Charles Joseph Minard: Carte figurative des pertes successives en hommes de l’Armée Française dans la campagne de Russie 1812-1813
The A, 50 × 70 and 60 × 80 cm PDFs of these posters, in every theme, are also in the latest release, in one zip per category: Historical data visualization.
Other series
-





5 posters · 2008 to 2020
Bitcoin, piece by piece
-




4 posters · 1905
1905, the miraculous year
-





5 posters · 1215 to 1791
Declarations
-





5 posters · 1969 to 1991
The origins of the Internet
-





5 posters · 1990 to 2011
The April Fools’ RFCs
-






6 posters · 1876 to 1970
Patents that changed the world
-




5 posters · 1610 to 1977
Looking up
-




4 posters · 1798 to 1929
Life
-



5 posters · 1703 to 1970
From binary to the mouse
-





5 posters · 1985 to 2007
Free software and ways of working
-






6 posters · c. 300 BC to 1900
Mathematics


